
About a month ago I had an opportunity to lead an interactive workshop organized by MasterOps Comminity (which is a great community and you should join it!) that was all about a problem that I’ve come across for many years: how exactly do you go from Dashboards to Decisions?
We spend so much time and effort just getting the data right and visualizing the data – as analysts – we often don’t take the final step which is offering a business-level recommendation.
You can go watch the entire presentation/workshop here:

Here’s a recap of what we talked about.
First of all, I paid homage to Avinash Kaushik (and his excellent blog and newsletter), who is one my favorite voices on this topic on the internet.
Here are some of my favorite Avinash blogs that you should check out:
- Digital Dashboards: Strategic & Tactical: Best Practices, Tips, Examples
- The Core Problem: The Failure of Just Summarizing Performance.
- The Solution: Text (Wisdom).
- Customized Data Pukes!
- Tactical and Strategic Dashboard Elements: Examples, Inspiration.
- Responses to Negative Data: Four Senior Leadership Archetypes.
- Archetype #1: The Bubble King (/Queen).
- Archetype #2: The Attacker.
- Archetype #3: The Rationalizer.
- Archetype #4: The Curious One.
- Excellent Analytics Tip #22: Calculate Return On Analytics Investment!
- ROA: Return on Analytics!
Anyway, the problem I’m trying to solve here is analysis paralysis. We’re so busy creating KPIs, charts and datasets that we don’t spend enough time actually looking at the data to make a meaningful impact to the business.
I remember as an analyst preparing a complete set of slides with a lot great marketing analytics and then sharing it with the CMO. Here’s what that one CMO told me about 3 slides into the deck (I’m paraphrasing here):
“Grant, I don’t have time for this. Yes, I can see that this is great and detailed dataset and honestly you did a great job, and if I had the time, I’m sure I could make sense of it. But I just don’t have the time to read all of this.
I’m an executive and I have many other responsibilities. I would like you to give me the highlights and recommendations and then we can discuss them.”
Busy CMO
And so I’ve been looking for a great way to be able to, yes prep the data and create the dashboards, but also not stop there, and go the last mile and make the business recommendations.
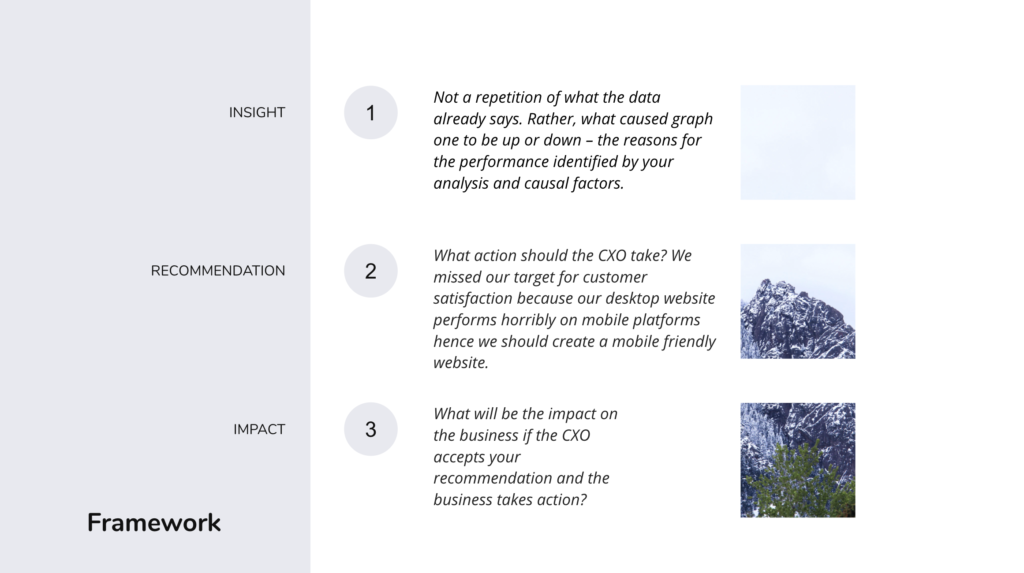
The Framework
Here’s a framework I’m proposing: combine the following 3 things in your recommendations:
- Insight: this an observation about the data that goes a layer deeper than what you can see on a chart. I like the insights to have some causal factors explained, rather than just data observations.
- Example: “The PPC Campaign is showing decreasing numbers because of change in our keyword strategy last month.”
- Recommendation: this should be an action oriented sentence. You should spell out what action you recommend the business take, when and and how much?
- Example: “We should double down on these LinkedIn Ads starting this month”
- Impact: What will be the impact on the business if the recommendation above is followed? This is very often the missing key ingredient that an executive needs to make an informed decision.
I then take an example dataset and work through how I would make the recommendation based on the data – following the framework above.
Here’s the example dataset:
You can click your way through the tabs to see what I do with the data to then arrive with these example recommendations:
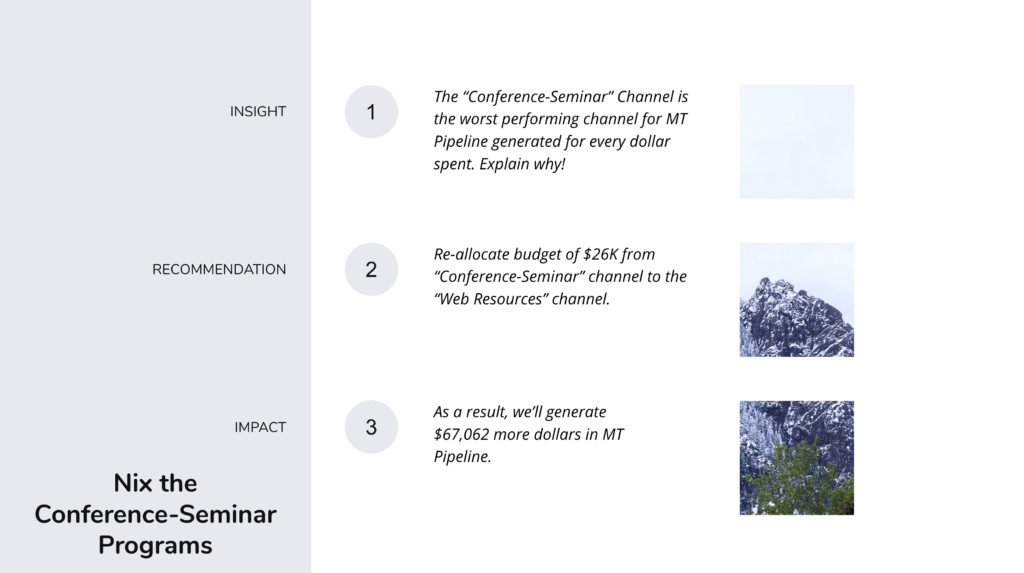
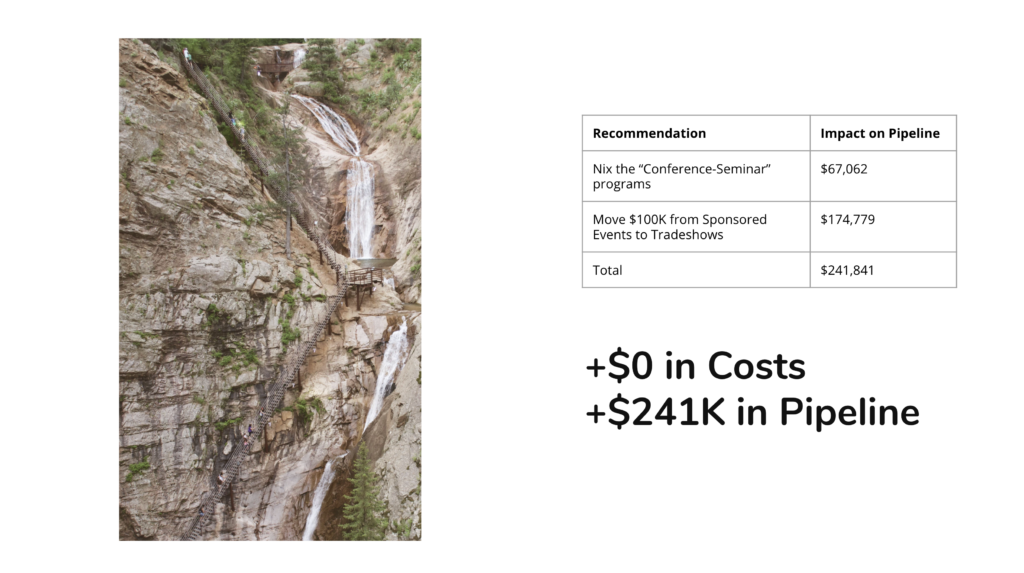
- Re-allocate $26K from “Conference-Seminar” channel to the “Web Resources” channel to generate an additional $67K.
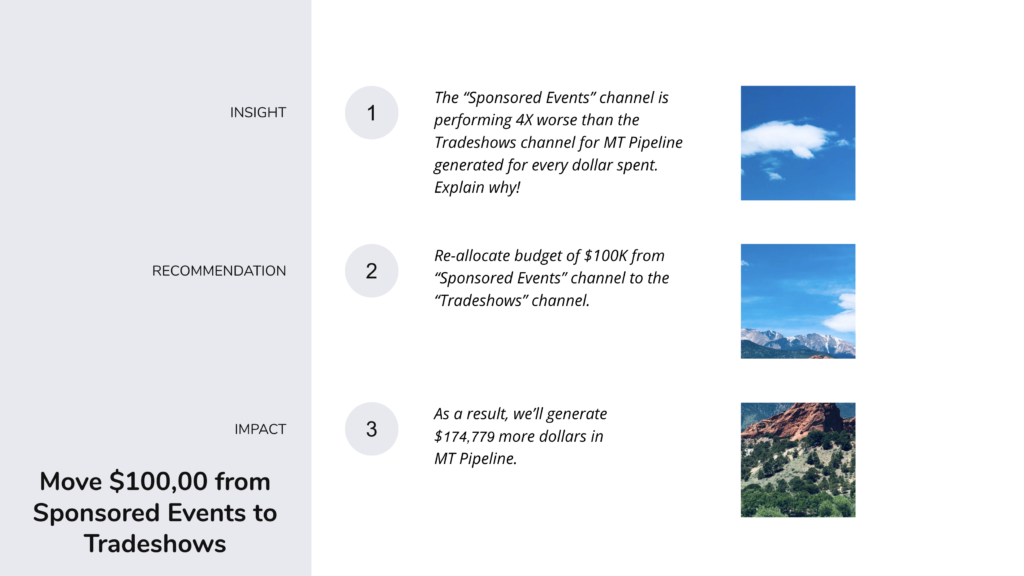
- Move $100K from “Sponsored Events” to “Tradeshows” to generate an additional $175K in pipeline. Obviously this recommendation was pre-covid!
And then you can summarize them together with a combined impact statement:
Now we’ve got business recommendations, based on data, triggered by insight and supported by estimated impact analysis. This is what a data-driven organization can be built on.
How do you present your recommendations?
What other ideas do you have to make this process even better?