
I know it’s been a while since I last wrote a blog post here – not since May of last year – and boy a lot has happened since in the world!
In this post I wanted to list out the types of projects we’ve been working on here at Signalon. Ok – let’s acknowledge that first: it’s a “we” now, not “I.” Last time I wrote a blog post here I was a lone freelancer and now we’re a team of 3, with even more friends and partners with whom we’ve been working together for the past year.
When I re-started consulting last year I intentionally didn’t want to say exactly what type of consulting I wanted to do because I wanted to be open to different types of business problems. And I still am! I’ve been really great to have the opportunity to work on so many different types of marketing analytics projects.
Here are some example projects we ended up working on:
Project: Marketing Analytics Audit + Recommendations
Before we make any recommendations or start building anything, we want to get to know you and your business. It’s important for us to understand your overall marketing strategy and how analytics fits into it.
A key part of the audit is reviewing how data comes into your systems, how it’s processed, and how you’re reporting on it today. We also want to understand what technology stack you’re using, and how it’s configured.
Once we understand your business strategy and the existing analytics capabilities, we will make recommendations based on our experience and your goals. Together, we’ll build an analytics roadmap and a plan to execute it based on your priorities.
These have been some of my favorite projects because they allow us to get creative and together with the client imagine how we could create a better solution.
And we often do use this framework to think about any gaps in reporting that a client might need to fill.
Project: Improve Lead Source in Salesforce: Defining Engagement Source
It turns out that a lot of companies are unhappy with how they track “Lead Source” in their CRM, and yet this one datapoint drives so much of their actual business decision making.
Organizations are using Lead Source to understand where Opportunities are coming from and because Lead Source is a single datapoint, eg “Marketing Webinar” or “Partner Referral” it misses the complexity inherent in a B2B sale cycle.
Even when companies are utilizing multi-touch attribution models, or more sophisticated measures of influence, Lead Source continues to dominate the conversation when it comes to Opps – because it’s just so simple – and it aligns to the mental model that asks “where did this Opp come from?” expecting a singular, clear answer.
So, in this type of a project we attempt to have our cake and eat it too: can we find a SINGLE ANSWER to the question of where did the Opp come from? Did it comes from a partner referral? Did it come as a result of some marketing campaign where we engaged a key person for the first time?
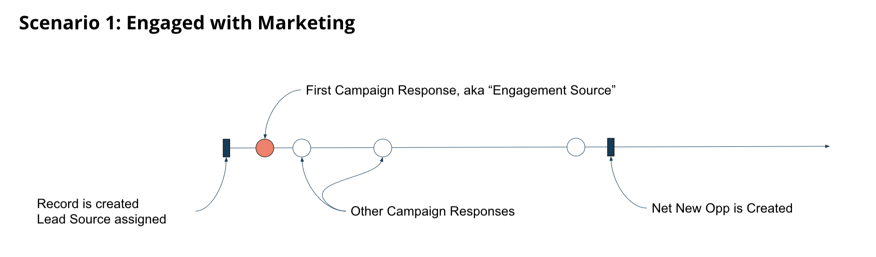
We work with the client to identify a dozen or so different likely scenarios that most often lead to an Opportunity. We then construct a formula that looks at all marketing, partner and sales data related to the Opp and provides an answer as to which scenario this Opp followed.
The resulting new field on the Opportunity is sometimes called “Engagement Source” – because the formula is often looking for the one activity that got the prospect to engage in a meaningful way for the first time – that then led to an Opp.
The formulation of this field requires cross-functional buy-in from sales, marketing and channel and therefore results in better alignment around this data vs using the old and stale “Lead Source.” It’s also much simpler to run reports against and understand than using a multi-touch modeling approach.
Project: Build Out Bizible Dashboards and Campaign ROI Lightning Charts
Another type of project that I didn’t expect to be working on but really enjoyed is working with Bizible. Even Bizible customers who are happy with the product still often need a some extra help with creating reports, dashboards and making additional customizations on top of the standard implementation.
I’ll highlight a couple of Bizible customizations that are interesting:
1. Add Bizible Data and Charts to Campaign Pages.
A standard Bizible implementation doesn’t seem to do a lot for your Salesforce Campaign Pages. It’s true that Bizible has a different data model that emphasizes “Touch Points” instead of “Campaigns” – but still – most of the interesting touch points are in fact Salesforce Campaigns.
So that got me asking – shouldn’t you be able to see results from Bizible attribution directly on the Campaign Page?
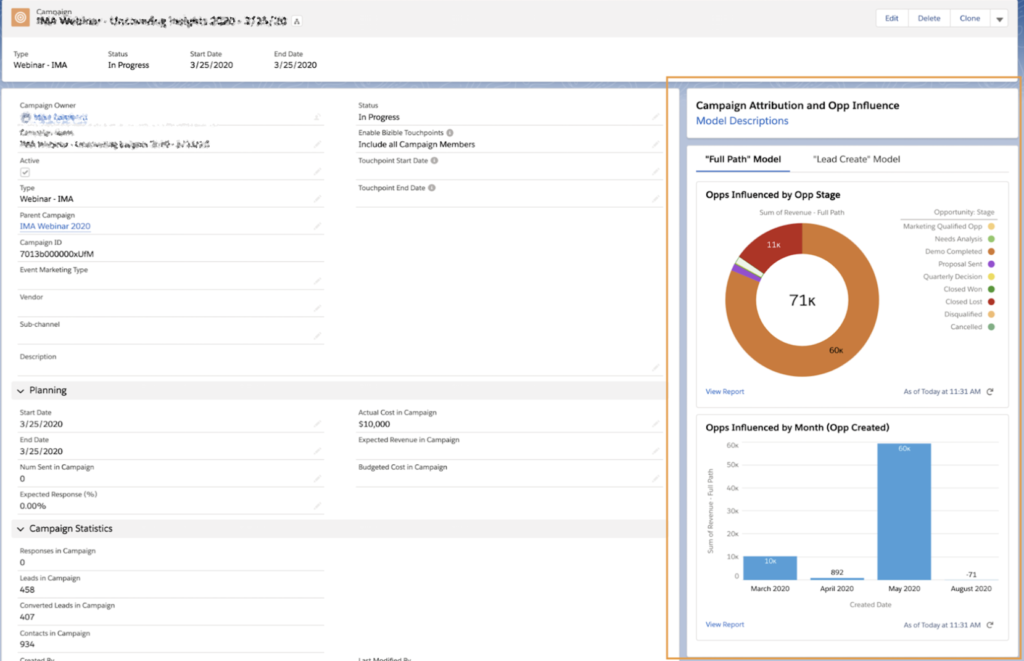
With the new Lightning interface in Salesforce, it’s not too much trouble to create Bizible Attribution reports that you can then add to the Lightning page layout – technically known as the “Lightning App”.
Here are the components I like to add:
- Link to the Bizible Model Descriptions – so that users are better understand what the models mean
- A tab for each model – “Full Path” model vs “Lead Create” model” vs “First Touch” models – whatever you find meaningful
- 2 charts per model:
- Donut Chart: Opp Influence by Opp Stage – so that marketers can see the total influence by Opp Stage – ie % that’s been won vs still open vs closed lost.
- Bar Chart: Opp Influence by Month – so that marketers can see the timing of the influence of this campaigns – ie how long it takes from the campaign to get the Opp Influence attribution.
2. Add Period Costs for Advertising Campaigns in SFDC and Calculate ROI
The other useful Bizible customization is bring advertising costs into Salesforce.
Salesforce Campaigns are great for one-off campaigns like email blasts or webinars or tradeshows – because those tactics have costs that are discreet and easy to track from one campaign to the next.
But advertising campaigns like Google Ads or LinkedIn Ads often have an ongoing cost that’s variable month over month. And there is no elegant way to capture all of this data in Salesforce.
So to help solve for this, we create a custom object called “Period Cost” and import monthly cost data into it. So that for each Campaign we can track costs over time:
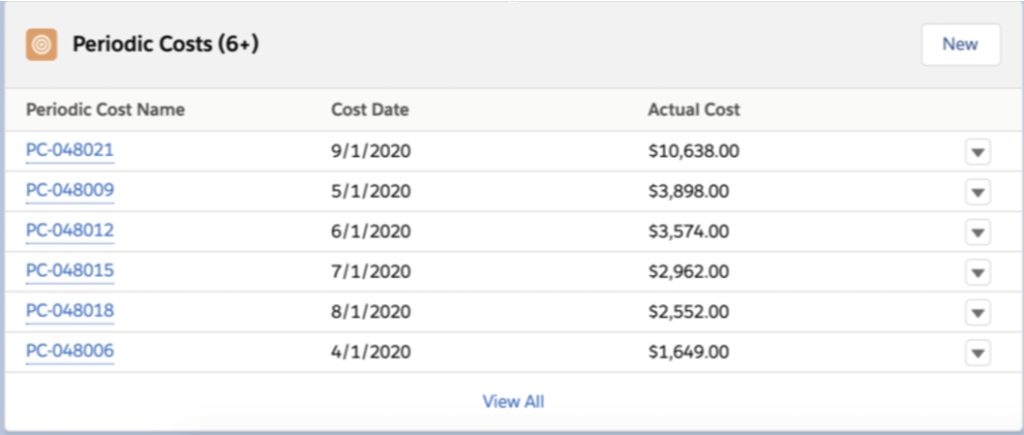
This should be totally familiar to Marketo admins – because Marketo has an equivalent feature for Programs called “Period Costs”
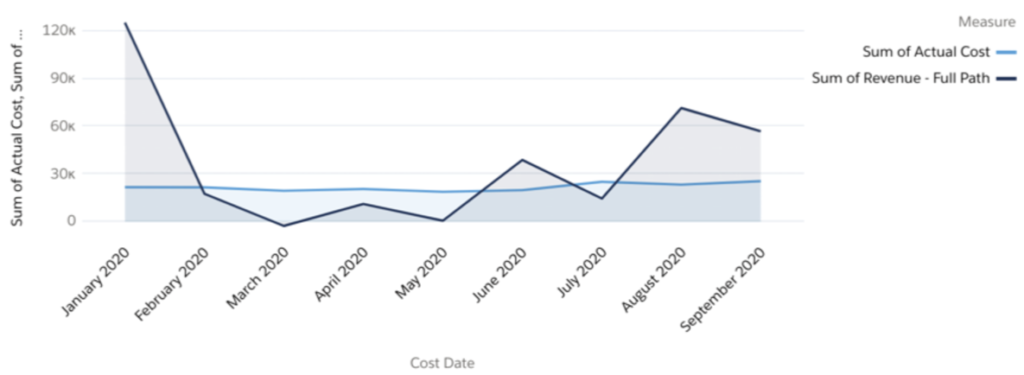
Once this data is in Salesforce – we can then also connect it with Bizible attribution data to calculate monthly ROI based on whichever attribution model we want to look at.
Project: Build Out Custom Multi-Touch Attribution in Salesforce
As I mentioned before, there is a way to build multi-touch attribution modeling directly in Salesforce without any APEX coding. We just use Lightning Flows.
We worked with a handful of customers to build this out in production and I’ll probably dedicate a separate blog post with all the learnings, but the overall it’s been pretty successful.
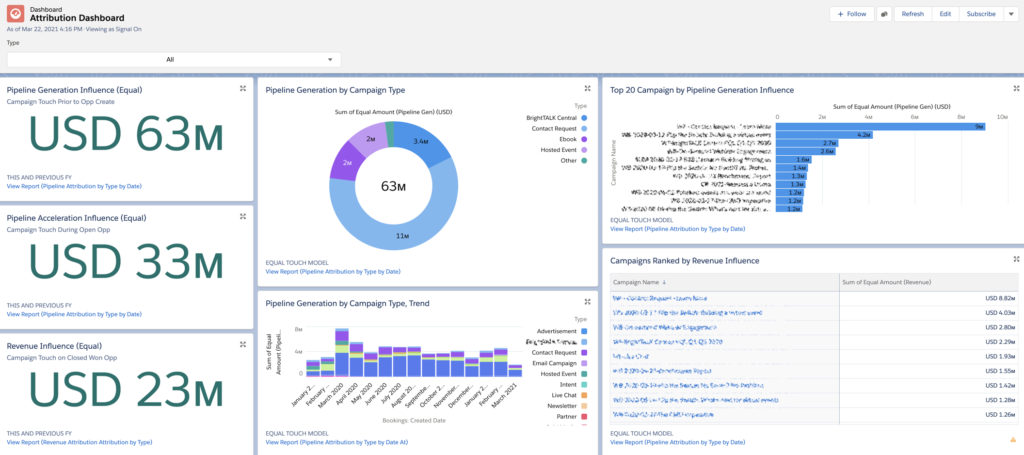
One cool addition that we’ve been able to make is the ability to create MANY measures of marketing influence:
- Pipeline Generation Influence – campaign influence BEFORE the Opp was created
- Pipeline Acceleration Influence – campaign influence DURING the time that the Opp was active and open
- Revenue Influence – campaign influence on closed won opps only
- Cross-sell/Upsell Influence – campaigns that influenced upsell and cross sell opportunities – specifically for deals that followed the initial deals.
- Renewal Influence – similar to upsell and cross-sell influence these are campaigns that helped with renewals
A single campaign can have influence on all of the above – and it’s been super interesting to be able to reveal all of these insights about campaign – and to have the power to create these metrics from scratch using Lightning Flows.
Project: Build Out Advanced Funnel Metrics in Salesforce
This is probably the most frequent project from last year – connect my Leads, Contacts and Opps to create a great marketing funnel dashboard in Salesforce:
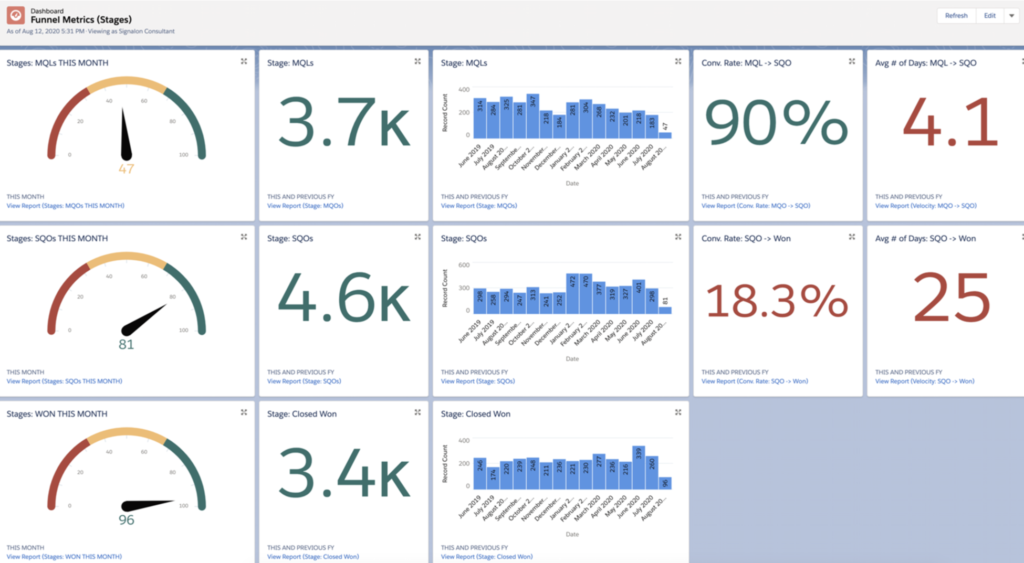
This customization is great because it takes advantage of custom objects in Salesforce to create a dashboard that shows exactly how many MQLs, SALs, SQLs and so on a customer has regardless of how they track that data (Leads, Contacts or their own customer objects like Meetings).
We then calculate the conversion rates and velocities directly in Salesforce as well.
Project: Build Out Data Warehouse + BI Dashboards (PowerBI, Tableau, Looker, etc)
A few of the projects involved using the customer’s data warehouse in combination with a data visualization tool like Tableau or Looker to create marketing analytics reports.
These tended to be larger customers, and the help that we’re able to provide is in terms of subject matter expertise. These companies tend to have excellent BI folks – who know a lot about how to store/connect/visualize data but don’t know much about marketing – and so we’re able to act as translators between the marketing team and their requirements and the data team and their capabilities.
I’ll write more about these projects in a dedicated post later!
Project: Clean-Up Salesforce Campaign Taxonomy + Hierarchy
Another type of project we’ve done is simply to help customers organize their Salesforce Campagns + Marketo Programs in a way that would make it easier to track and reporting on – regardless of which attribution solution they are using.
In these types of projects, we review the customer’s existing campaign structure and then work together to come up with something that’s consistent, sustainable and allows for meaningful reporting.
We even ended up creating our own Campaign Structure that we like. But this is by far not the ONLY way to structure your campaigns – so we’ve been working closely with customers while being open minded and asking lots of questions about what they need.
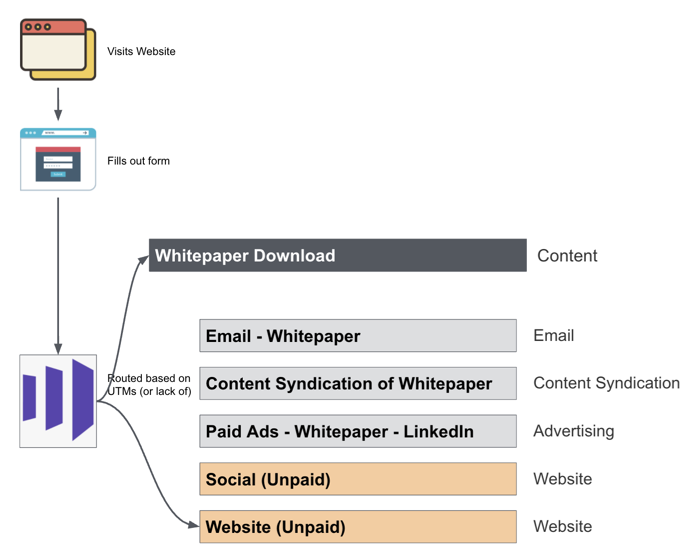
For example, some customers run multi-channel campaigns – and it’s helpful for them to setup Parent/Child relationships that capture the way they market:
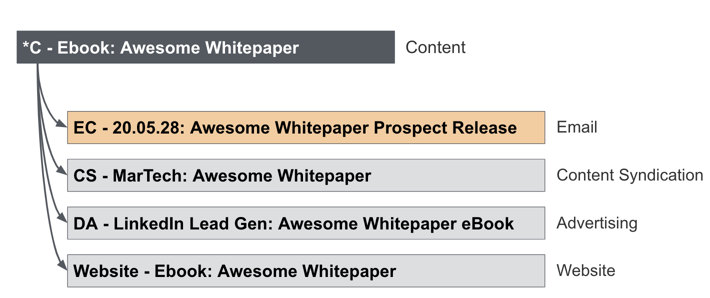
We also advised on the required Marketo back-end work that’s often necessary to enable this type of structure:
These are the types of campaigns we’ve worked on in the past year – and I don’t know if these are the same types of campaigns that we’ll end up working on this year.
Most recently, I’ve been more interested in data analysis and interpretation vs technical solutions. So I’m hope that this year, we’ll do more analyzing data and helping marketers make better decisions using the data. Stay tuned for more on that here.